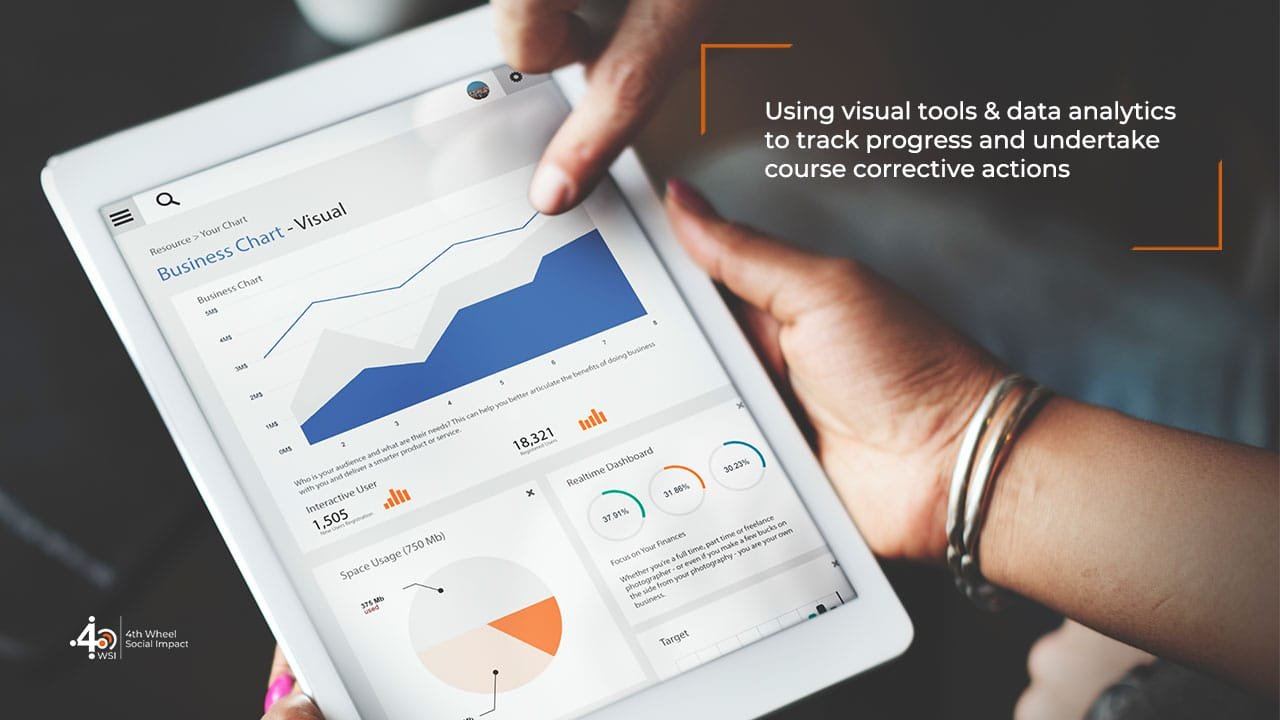
Dashboards track social performance and enable analysis based on innovative visualisations and tools to identify priorities for action. This data-driven initiative enables participation from a broad range of stakeholders.
Assignment Type: Technology and Data Analytics
Thematic Domain: Healthcare
Overview: Owing to poor data, there were no target-oriented approaches, monitoring, or tracking of progress of healthcare access in rural areas of our client’s operations. This resulted in a lack of transparency and accountability while dealing with the Covid-19 crisis. A basic dashboard, based on available secondary information of the Community Health Centres, Public Health Centres, and District hospitals and related capacities, was built. This was substantiated with data from phone consultations with local influencers and healthcare professionals. The dashboard enabled the organisation to prioritise locations and areas of support while monitoring the improvement in healthcare access.
Benefits: The dashboard helped to map different development actors and their related programmes and form strong multi-stakeholder partnerships, where there was a blended financing model allowing for health system upgradation and eventually greater impact.
Based on local realities which were highlighted for different geographies, social development plans were customised and target-oriented with regular monitoring systems built into the programme design, creating customised impactful programmes.


